So you’ve got a brilliant idea, a killer team, and you’re ready to pitch your startup to investors. But before you hit the stage, there’s one crucial element your pitch deck needs: solid business metrics. Metrics are the data that tells the story of your company’s health, potential, and ability to avoid the dreaded startup graveyard.
Moreover when we are talking about investors. They are looking for more than just passion. They want to see cold, hard numbers that demonstrate traction, growth, and a clear path to profitability. Let’s dive into the key business metrics you should showcase in your pitch deck and how they can guide your startup towards success.
what’s in the article
- User/Customer Acquisition Cost (CAC)
- Customer Lifetime Value (LTV)
- User/Customer Growth Rate
- Churn Rate
- Total Addressable Market (TAM)
- Recurring Revenue
- Average Revenue Per User (ARPU)
- Revenue per Employee
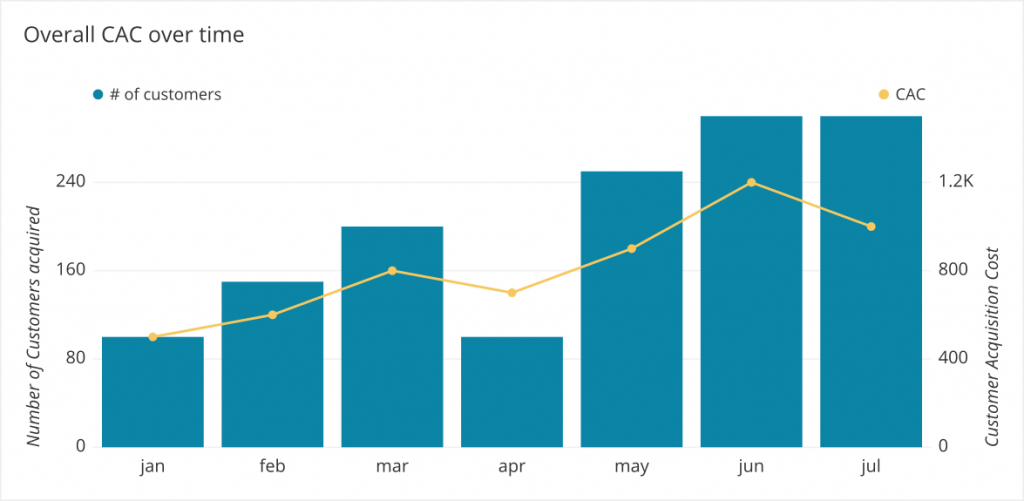
User/Customer Acquisition Cost (CAC)
This metric reveals how much it costs you to acquire a new user or customer. It’s crucial for understanding your marketing and sales efficiency.
Practical Use
Let’s say your CAC is $50 and your average customer pays you $100 per year. This means you need your customer to stick around for at least two years to recoup your acquisition cost and start turning a profit. Understanding CAC allows you to optimize marketing campaigns and focus on channels that deliver customers at a sustainable cost.
Influence on Product/Company
A high CAC might suggest a need to refine your target audience or explore more cost-effective marketing channels. Conversely, a low CAC indicates a strong value proposition that resonates with your target market.

Customer Lifetime Value (LTV)
This metric represents the total revenue a customer generates throughout their relationship with your company.
Practical Use
Imagine you have an LTV of $200 and a churn rate (percentage of customers who leave in a given period) of 10% per month. This means you need to acquire new customers constantly to offset churn and maintain revenue growth. A high LTV allows you to invest more in customer retention strategies, knowing the long-term benefits outweigh the short-term costs.
Influence on Product/Company
A low LTV might signal a need to increase customer engagement, upsell premium features, or explore subscription models to create recurring revenue streams.
User/Customer Growth Rate
This metric shows how quickly your user base or customer base is expanding.
Practical Use
A strong and steady growth rate demonstrates traction and market demand for your product/service. It also helps project future revenue and user base size.
Influence on Product/Company
Slow growth might indicate a need to improve product features, refine marketing strategies, or consider entering new markets. High but unsustainable growth could signal an over-reliance on a single marketing channel that might dry up in the future.
Churn Rate
We mentioned churn rate earlier, but it deserves its own spotlight. This metric reveals the percentage of users or customers who stop using your product/service in a given period.
Practical Use
A low churn rate indicates a loyal customer base and a product that solves a real problem.
Influence on Product/Company
A high churn rate suggests a leaky bucket. You’re constantly acquiring new customers, but losing existing ones at a concerning rate. This necessitates focusing on customer retention strategies like improved customer service, loyalty programs, or product enhancements based on user feedback.
Total Addressable Market (TAM)
This metric defines the overall market size for your product or service.
Practical Use
TAM helps you understand the potential revenue opportunity for your business. It also helps you assess competition and market saturation.
Influence on Product/Company
A large TAM indicates a potentially massive customer base and significant growth potential. A small TAM might necessitate a niche focus or exploring ways to expand your market reach.
Recurring Revenue
This metric shows the portion of your revenue that comes from recurring sources like subscriptions or contracts.
Practical Use
Recurring revenue provides predictable income and facilitates financial planning.
Influence on Product/Company
A high percentage of recurring revenue indicates a stable and predictable business model. Low recurring revenue might suggest a need to explore subscription options or implement features that encourage customer loyalty.
Average Revenue Per User (ARPU)
This metric reveals the average amount of revenue generated by each user over a specific period.
Practical Use
ARPU helps you assess pricing strategy and customer lifetime value.
Influence on Product/Company
A high ARPU indicates an effective pricing strategy or a product that caters to a high-value customer segment. A low ARPU might necessitate exploring premium features or upsell opportunities.
Revenue per Employee
This metric shows how much revenue each employee generates.
Practical Use
This metric helps you assess your team’s efficiency and productivity.
Influence on Product/Company
A high revenue per employee indicates a well-oiled machine where employees are generating significant value. A low revenue per employee might suggest inefficiencies or a need to optimize workflows.
By incorporating these metrics into your pitch deck, you’ll provide investors with a well-rounded view of your startup’s health and potential for success. Remember, metrics are a means to an end. Use them to tell a compelling story about your startup’s journey and its bright future.
Focus on the metrics that best illustrate your company’s stage, target market, and business model. Don’t overwhelm investors with a data dump. Instead, tell a compelling story using metrics as the evidence that your startup is poised for success. By keeping a close eye on these key metrics, you’ll be well on your way to avoiding the pitfalls of the startup world and soaring towards a profitable future.

About author
Roman Bondarenko is the CEO of EVNE Developers. He is an expert in software development and technological entrepreneurship and has 10+years of experience in digital transformation consulting in Healthcare, FinTech, Supply Chain and Logistics.
Author | CEO EVNE Developers


